Absence Desktop
Until now, the counting of the absence index was carried out through a complicated process of extracting data from Excel – the results presented in this form are poor and imprecise, they do not provide any further analysis and conclusions.
The Absence Desktop was created in response to the needs reported by our Clients. Few input data – Employment status, ZUS PUE
An application written in a technology that allows to display data from general to very detailed – the absence rate is influenced by individual employees and their participation in generating the absence value is characterized individually
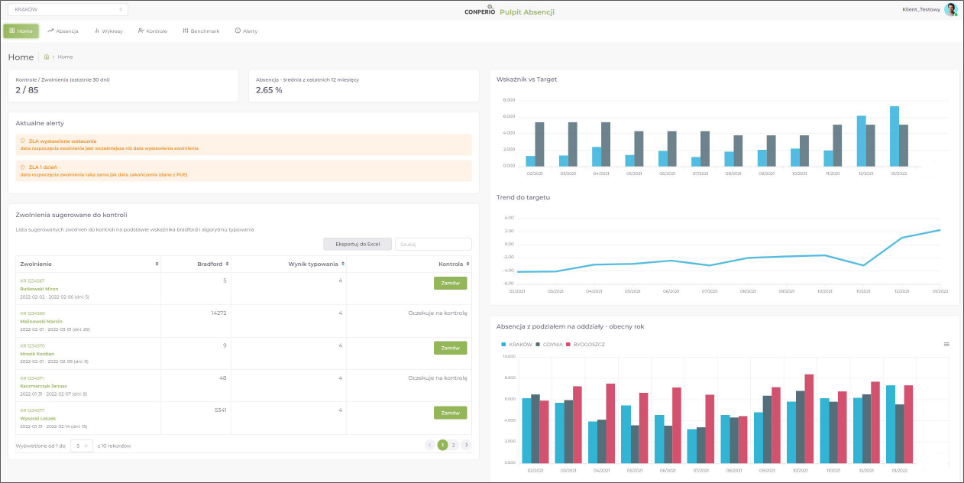
The Absence Desktop is a tool that not only calculates the indicator in real time, but also:

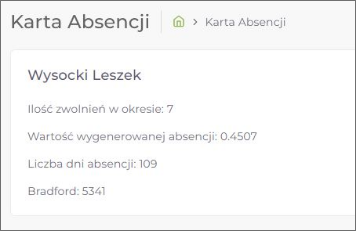
counts the Bradford index for individual components of absence

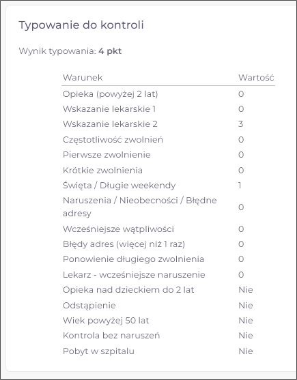
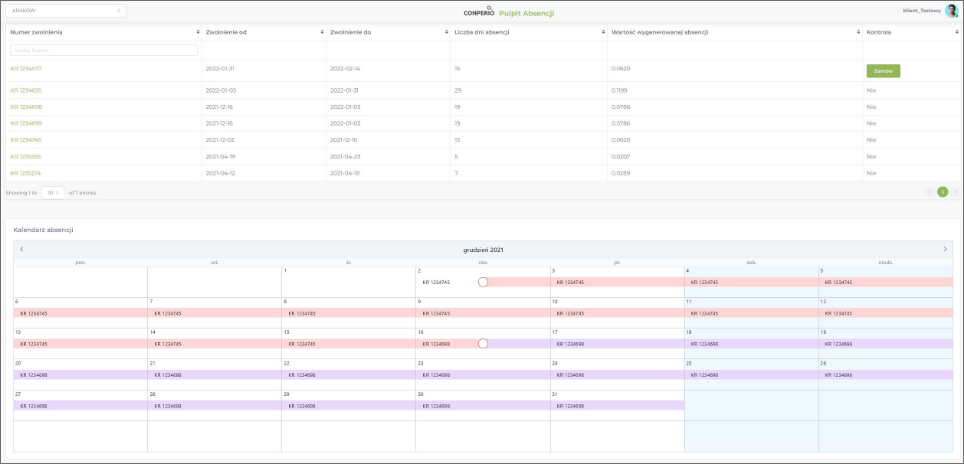
gives the values of the proprietary system for the selection of sick leaves for the Conperio control created on the basis of complex algorithms of its own authorship (individual indicator calculated on the basis of such data as the duration of the sick leaves, their repeatability, medical indication, calendar analysis taking into account the sick leaves on days off and a number of other components of the entire system of selection.

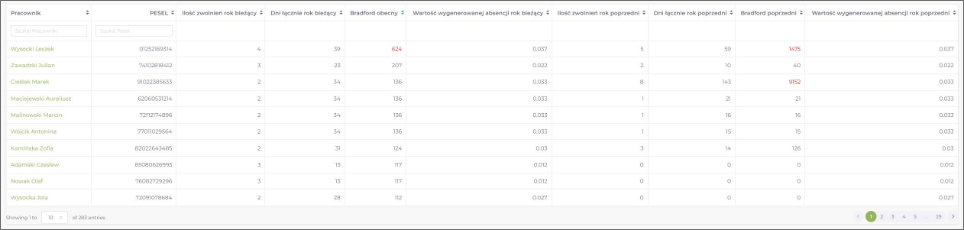
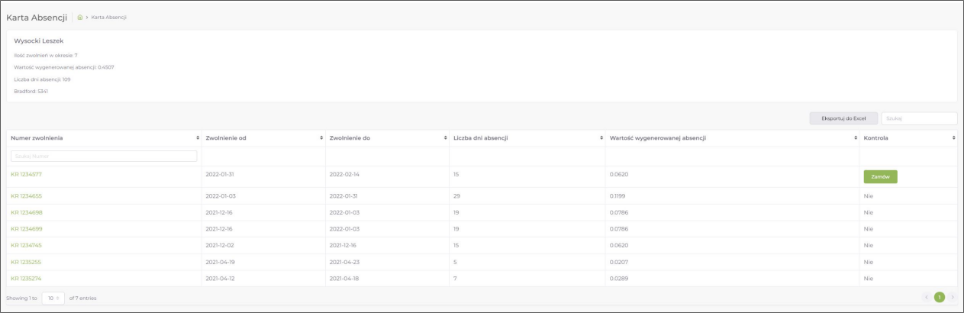
provides a full analysis of sick leaves in terms of each employee with an indication of sick leave days generated, the number of sick leaves generated with a calendar analysis, the share in the general absence rate for the workplace, and the same data for the previous year, as well as the Bradford index.

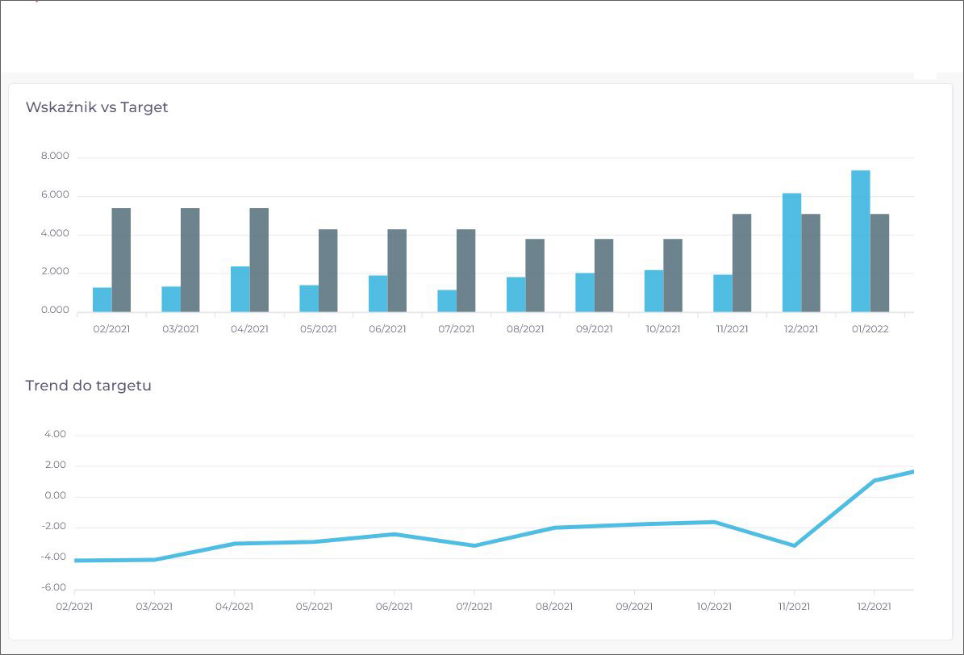
allows to observe the trend and the absence value itself, as well as the indicator in relation to the target on the absence index.

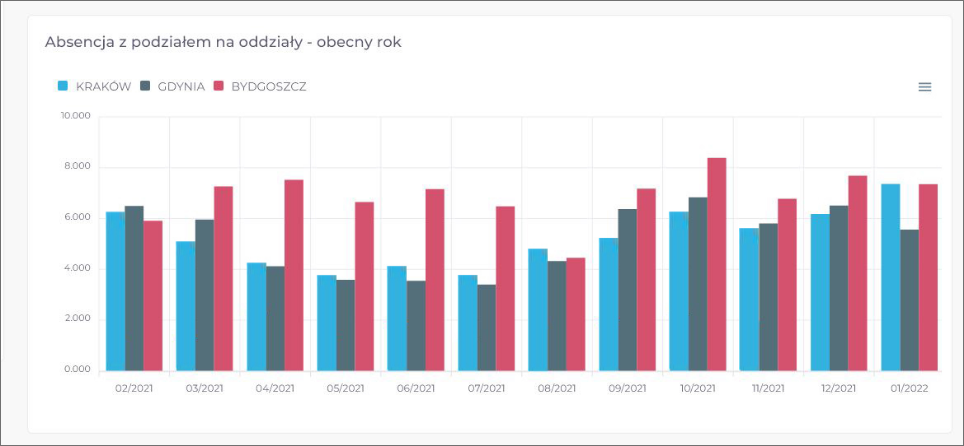
freely allows you to compare absence values between different branches of the company, allowing you to monitor the index for the entire group

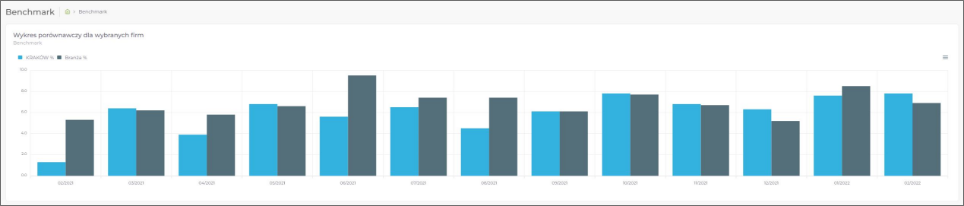
continuously updates sickness absence benchmark based on data selected in terms of size, industry, location, gender and age – calculated according to the same criteria for all participants of the study, from raw ZUS PUE data

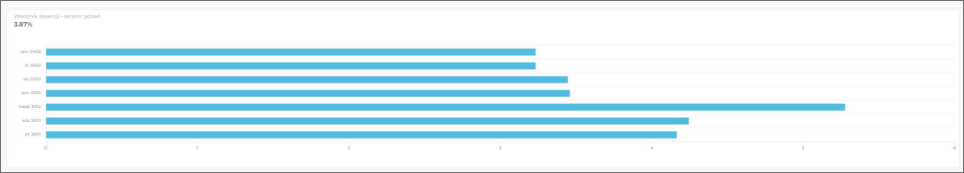
provides distribution of sickness absence on a weekly basis, with the absence rate for the current week – with an individual division per individual employee


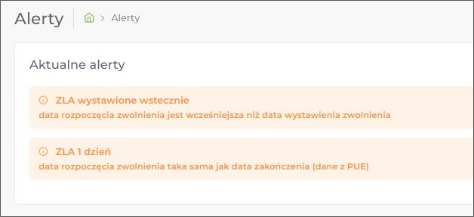
will automatically report unusual situations and unusual behaviors related to sick leave – alert system

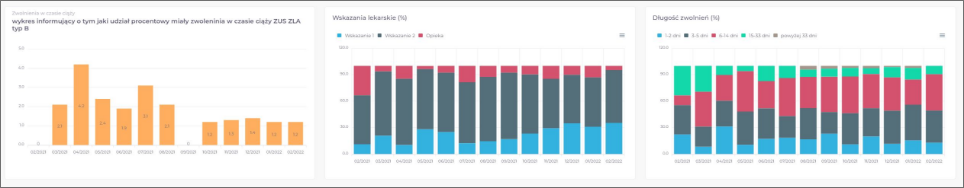
provides detailed analysis, taking into account the division into groups of the duration of sick leaves divided into short, long and very long term. Division into medical indications 1, 2 and O – care, taking into account the B index – pregnancy, together with analysis for individual employees

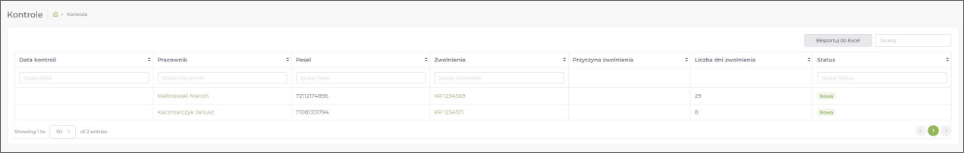
module for direct ordering of control from the application level based on the analysis of data from the Desktop, linking the desktop with the results of performed controls, full analysis of documents and results of sick leave controls
The responsibility for the absence rate is wrongly attributed entirely to the HR departments. Typical Analyses performed with the use of traditional tools are long-lasting and time-consuming, the Desktop contains all data and answers, is an immediate source of information and gives you the ability to address them to the right structures.
Additionally, the desktop provides opportunities to shape personnel policy based on data.
In addition, it gives a very deep insight from the overall indicator, detailed employee participation – supports decision-making process at the highest levels based on actual data, eliminating subjective feelings of direct superiors and opinions about a given person.
Based on such a detailed analysis, irregularities in the area of absence can be quickly prevented – a person showing worrying tendencies can be referred to sick leave control directly from the application.
In addition, the application provides substantive numerical support in the scope of conducting post-absence and corrective talks– giving insight into the annual sickness absence rate, duration of sick leave, medical indications, number of sick leaves and reference to the background of the plant.